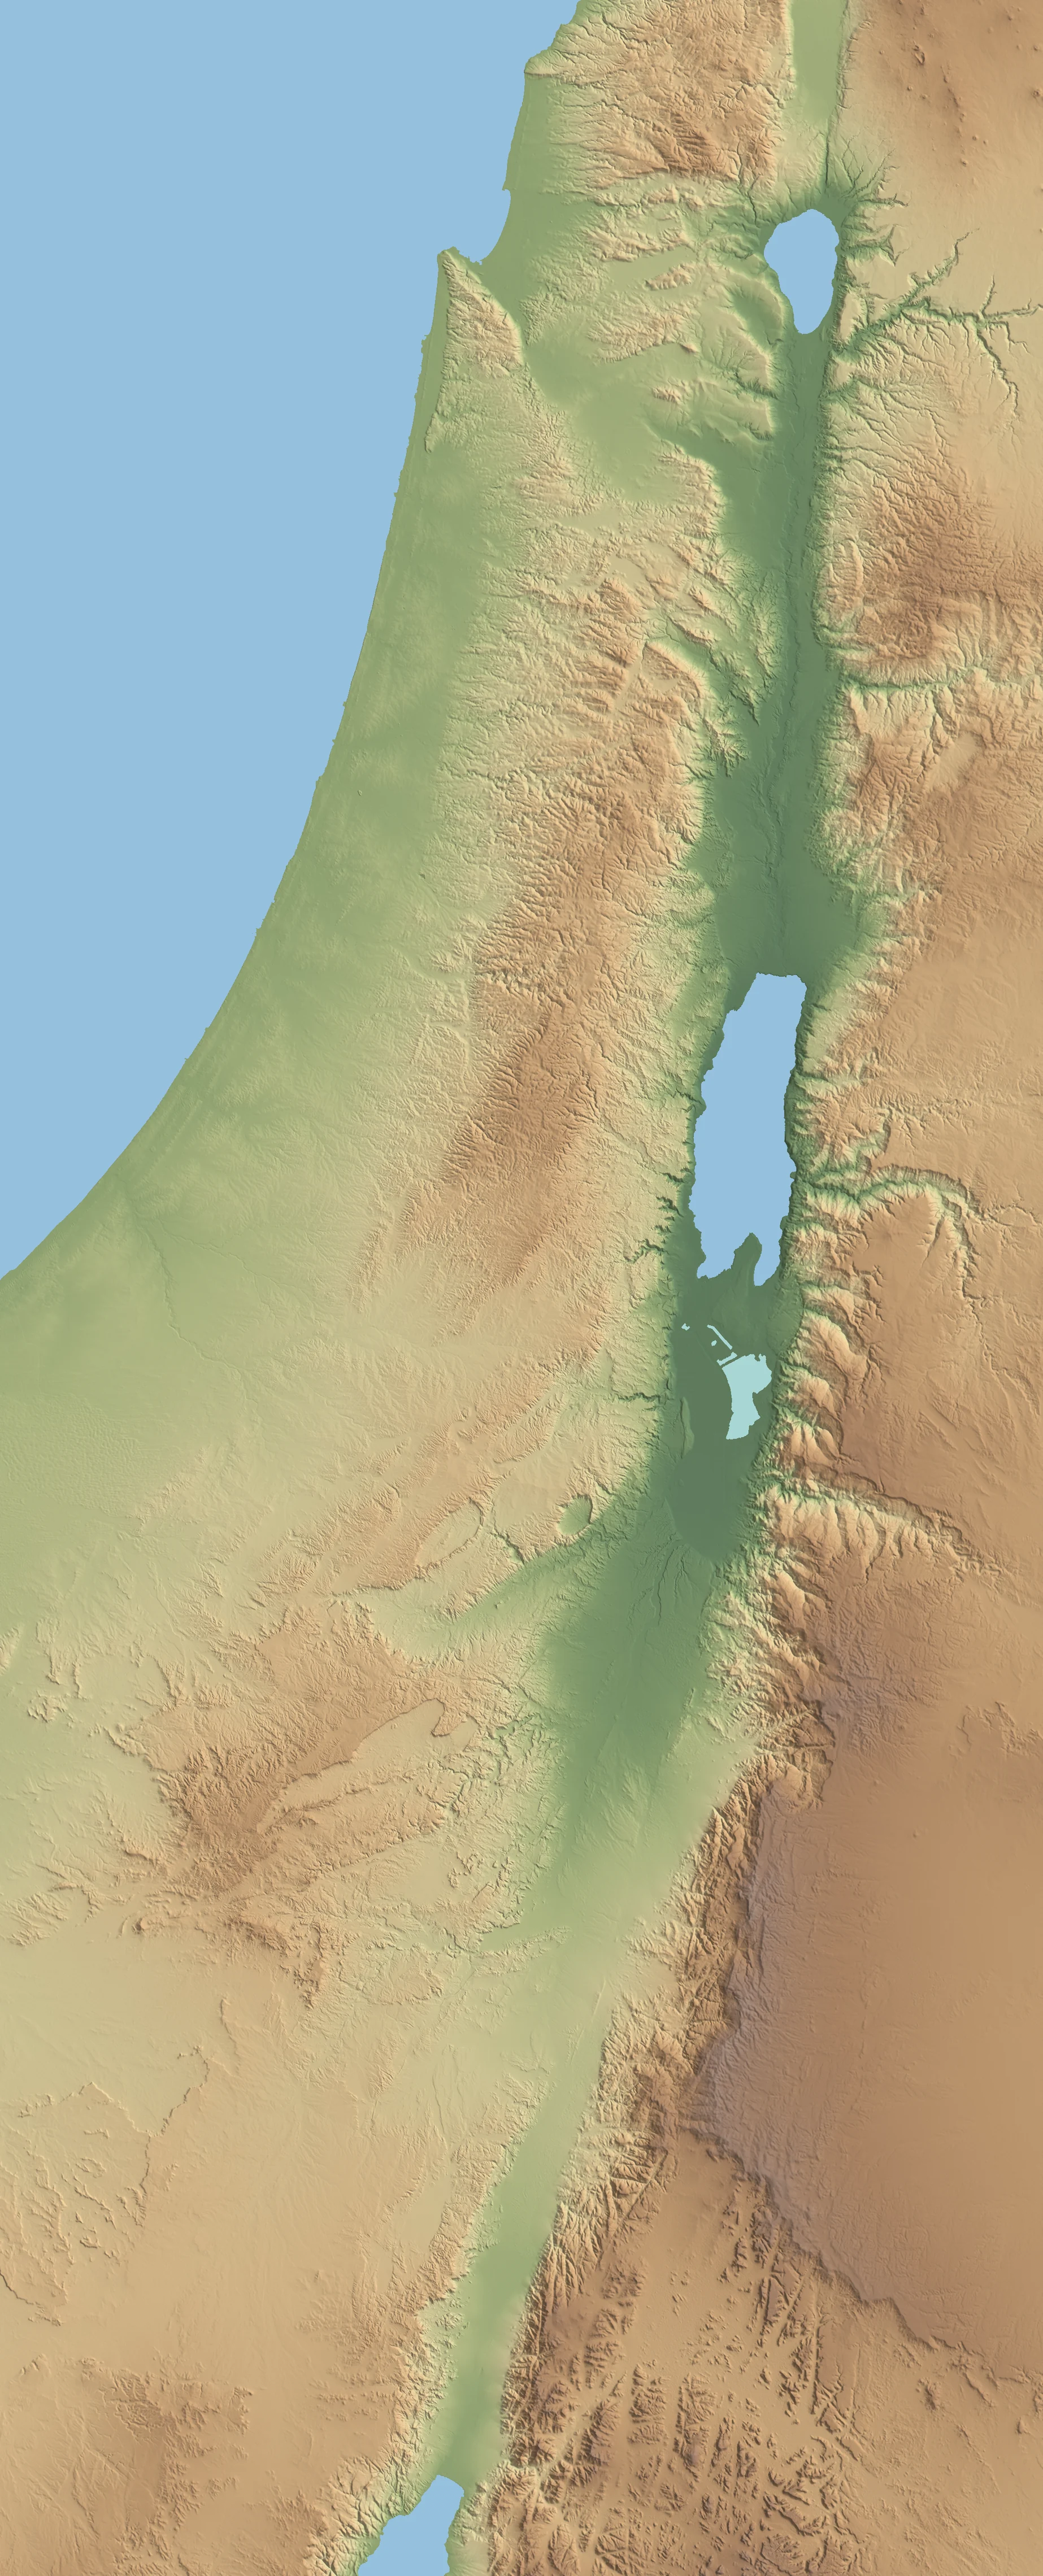
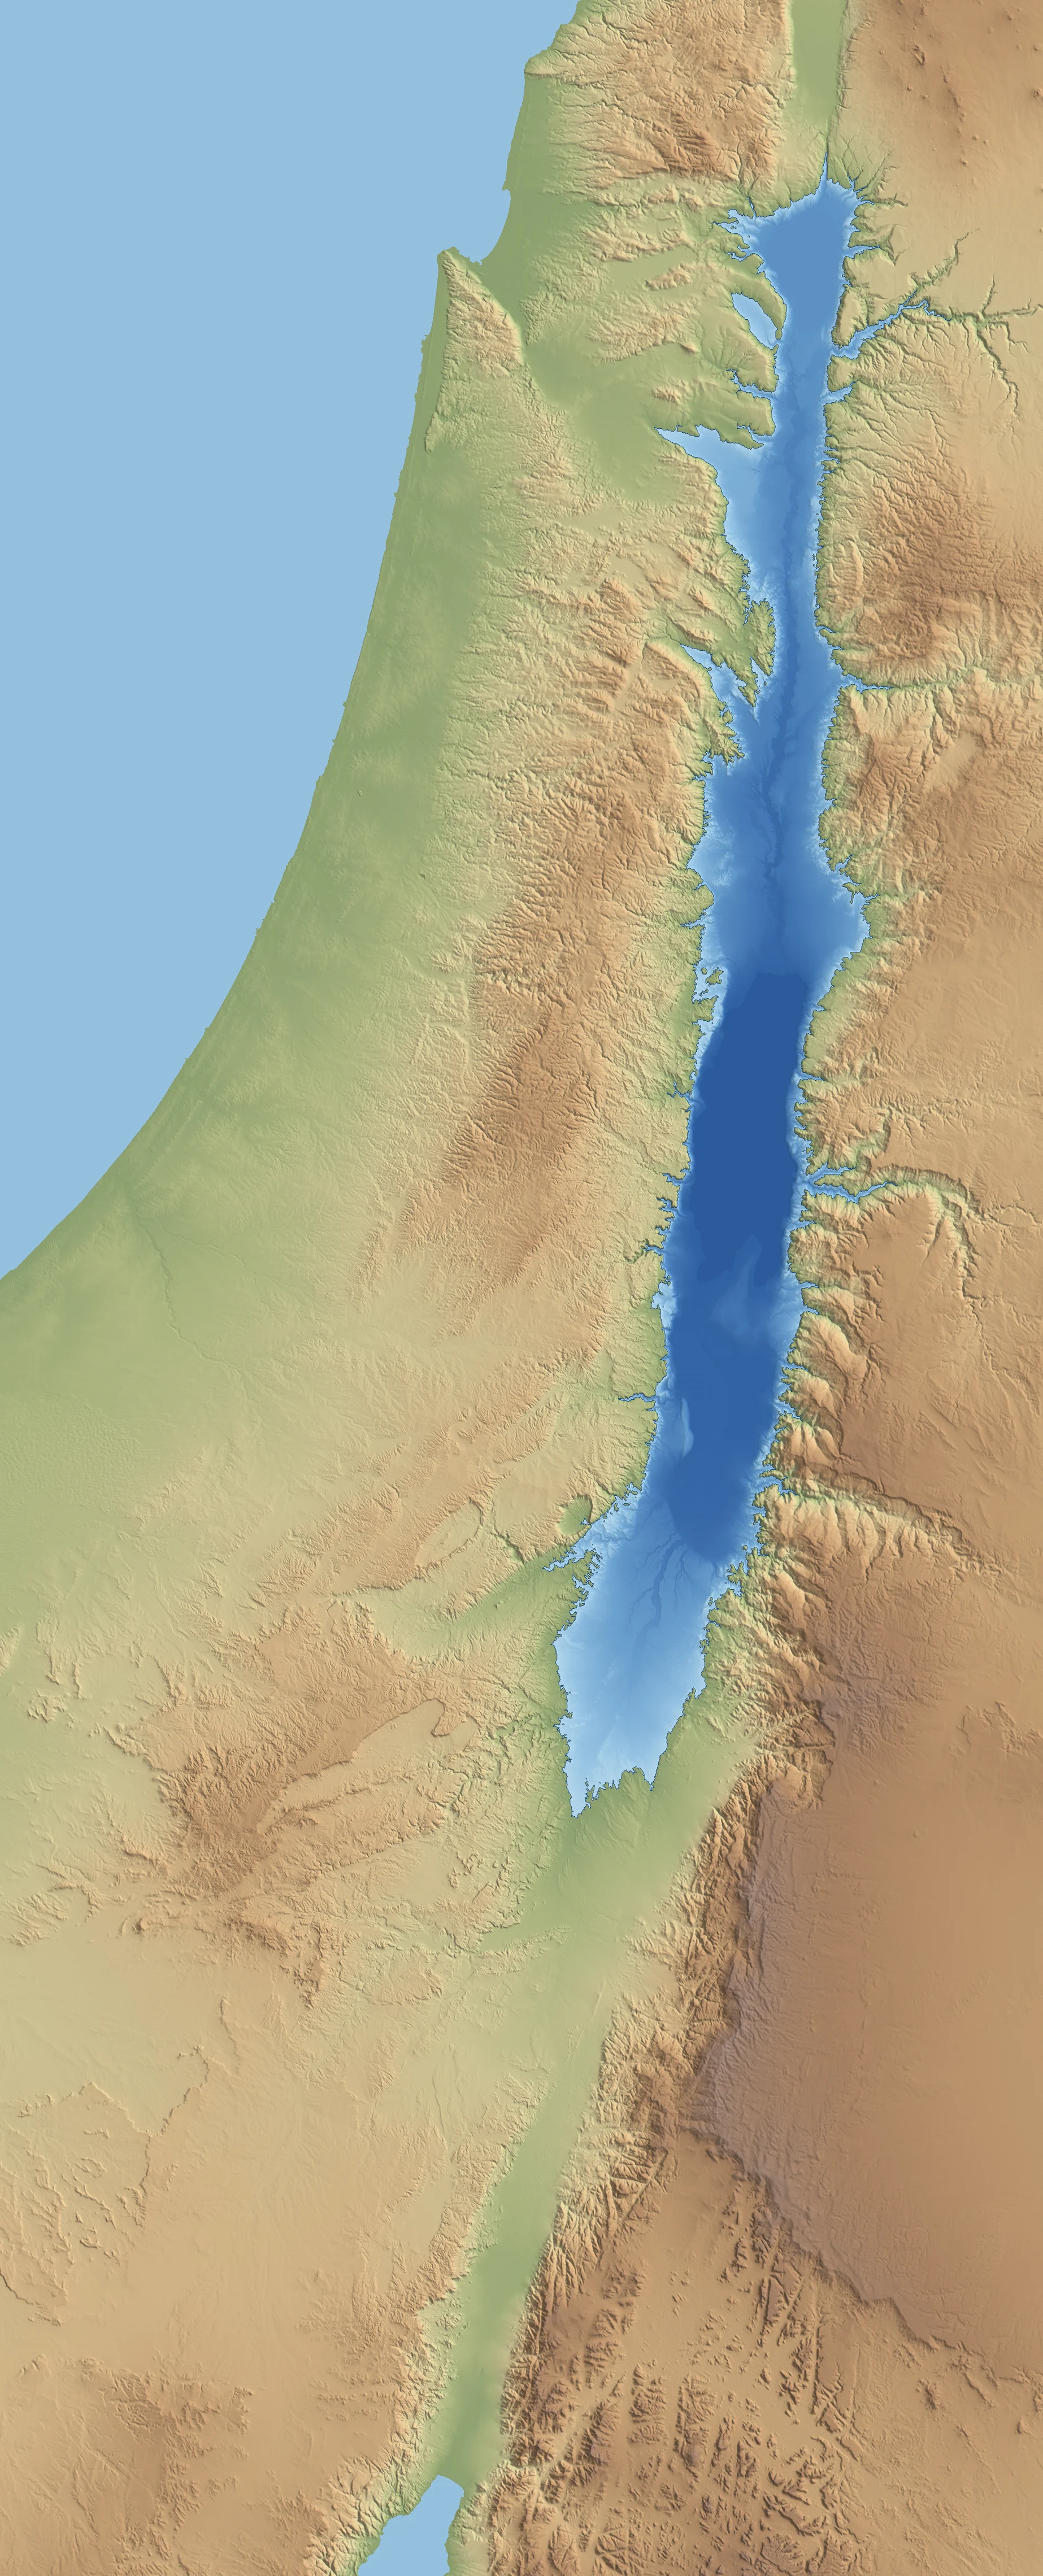
Aqaba Canal Flood Map
Open the rift to the Red Sea at Aqaba (and to the Mediterranean through the Jezreel Valley) and every piece of ground below sea level that drains to the Dead Sea goes under water. That is 5,032 km², a new sea 274 km long reaching from Tzofar in the Arava to the Jordan gorge above the Sea of Galilee, holding 1,191 km³ of added water.
SummaryWhat floods
The shoreline follows the 0 m contour. In the south it closes in the Arava at Tzofar, 110 km north of Aqaba. In the north it runs past the Sea of Galilee up the Jordan gorge to 32.98° N. Side arms reach west up the Harod Valley toward Afula and east up the Yarmouk gorge to 35.84° E. Masada's summit (52 m in this data) stays above water as an island of 0.15 km².
| Territory (Natural Earth borders) | Flooded km² | Share |
|---|
The cutsTwo sea-level channels
A true sea-level link needs open cuts through the two divides that separate the rift from the sea. The lines on the map are the least-excavation routes through the lowest passes in the elevation data.
| Cut | Length | Divide | Rock above 0 m, per 100 m of width |
|---|
The lowest possible divide on any path is 209 m for the Red Sea and 61 m for the Mediterranean. The mapped routes cross at 212 m and 62 m because they also keep the total cut small. Rock volumes count only material above sea level in a vertical-walled channel; side slopes and navigation depth come on top.
Ground profile along the whole waterway, Haifa Bay to Eilat–Aqaba, about 411 km by the shortest line through the new sea. Red is rock to remove; blue is the new sea. Vertical scale exaggerated about 200 times. The Dead Sea's own water (about 300 m deep below its surface) is not in the elevation data.
SettlementsWhat goes under
Ground heights are read from the elevation grid at each place's centre, listed north to south.
| Place | Ground | Outcome |
|---|
If the canals fall shortExtent at lower levels
A sea-level canal has to keep replacing evaporation. Assuming 1.5 to 2 m a year off 5,032 km² of open water, that is 7.5 to 10 km³ a year, or 240 to 320 m³/s of steady inflow. If the cuts cannot pass that much, the surface settles below sea level. This table shows how the new sea shrinks as the level drops.
| Water level | Area km² | Volume km³ | South end | North end |
|---|
Filling time depends only on net inflow: 1,191 km³ takes about 38 years at 1,000 m³/s, and about 7.5 years at 5,000 m³/s.
MethodHow the extent was computed
- Elevation comes from ten 1° × 1° tiles at 1 arcsecond (about 30 m) covering 29–34° N, 34–36° E, from the Israel Hiking Map terrain cache (SRTM1/ASTER-derived). Vertical error is roughly ±10 m, which also bounds the divide heights.
- Sea surfaces are empty in the tiles and were set to 0 m. Forty-six tiny gaps on land were filled from neighbouring cells.
- A cell floods if it lies below 0 m and connects to the Dead Sea through other cells below 0 m. Isolated hollows below 0 m elsewhere stay dry.
- The tiles show the Dead Sea surface at −432 m. The lake has kept falling by about a metre a year since, so the true fill volume is a few km³ larger than 1,191.
- Routes were traced on a 3-arcsecond grid by least-cost search, minimising ground height above sea level along the line and forced through the lowest pass.
- Territory areas use generalised Natural Earth 1:10 m boundaries and are approximate near the border lines.
- The idea is old: in 1855 William Allen argued for a Mediterranean–Red Sea canal by way of the Jordan Valley and the Dead Sea as a rival to Suez.